What is Carbon Accounting? A Comprehensive Guide
Introduction
As the world faces the reality of climate change, businesses and organizations are increasingly being held accountable for their carbon emissions. With governments, environmental groups, and the general public calling for more transparency and action, businesses are looking for ways to track, manage, and reduce their carbon footprint. This is where carbon accounting comes into play.
Carbon accounting is a systematic approach to measuring, recording, and reporting the carbon emissions generated by an organization’s activities. Whether it’s energy consumption, transportation, or waste production, carbon accounting provides businesses with the insights they need to minimize their environmental impact and comply with regulations. In this guide, we’ll dive deep into what carbon accounting is, why it’s important, and how businesses can implement it to drive sustainability efforts.
What is Carbon Accounting?
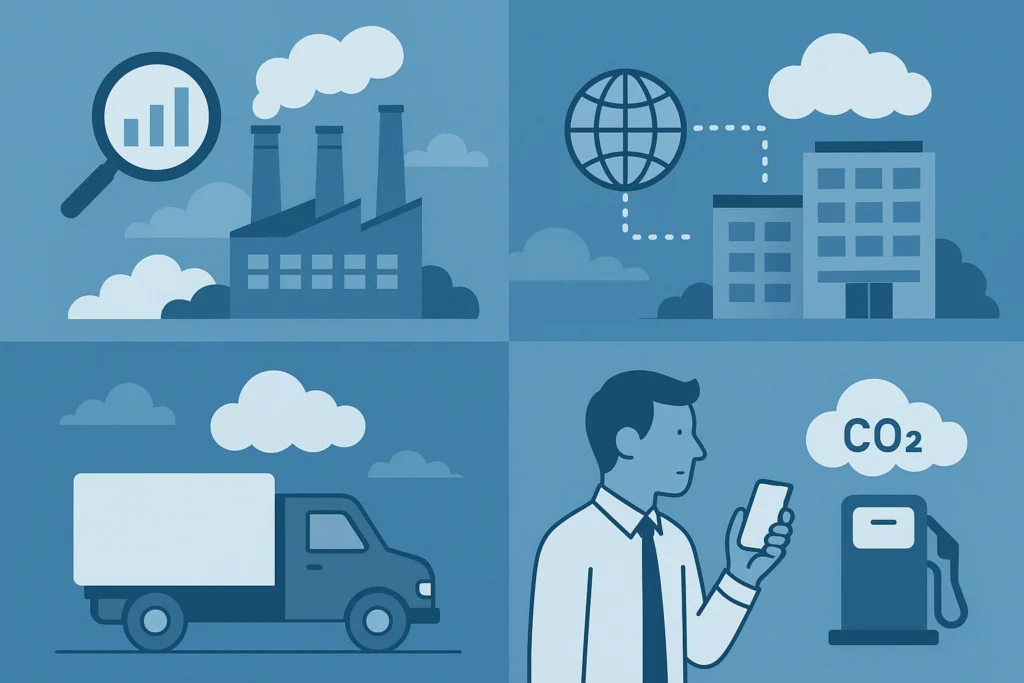
Carbon accounting refers to the practice of measuring and managing the amount of carbon dioxide (CO2) and other greenhouse gases (GHGs) that are emitted by a business or organization. These gases contribute to global warming and are primarily produced through human activities such as burning fossil fuels, manufacturing, transportation, and waste generation.
The process of carbon accounting helps businesses understand their carbon footprint—the total amount of carbon emissions they are responsible for. By calculating and tracking these emissions, companies can take actionable steps to reduce their environmental impact. Essentially, carbon accounting is the foundation of a company’s sustainability strategy.
Why is Carbon Accounting Important?
1. Regulatory Compliance
One of the primary reasons why carbon accounting is so important for businesses is to meet regulatory requirements. Governments worldwide are increasingly imposing stricter environmental regulations, including carbon emissions reporting. Many countries require businesses to disclose their carbon emissions to comply with environmental standards and climate goals.
For instance, regulations such as the Paris Agreement call for carbon neutrality by 2050, meaning businesses must reduce their emissions over time to meet global climate targets. Proper carbon accounting ensures that companies stay compliant with these regulations and avoid legal penalties.
2. Environmental Impact Reduction
Carbon accounting helps organizations identify the major sources of their carbon emissions. This information is crucial for developing strategies to reduce emissions and implement sustainable practices. By tracking emissions, businesses can identify areas where they can make a meaningful difference, such as switching to renewable energy sources, optimizing logistics, or reducing waste.
By actively engaging in carbon accounting, businesses can significantly reduce their carbon footprint, helping to mitigate the impacts of global warming and improve the overall health of the planet.
3. Cost Savings and Efficiency
One of the often-overlooked benefits of carbon accounting is the potential for cost savings. By tracking energy usage and identifying inefficiencies, businesses can find opportunities to reduce costs. For example, carbon accounting can help a business realize it is using more energy than necessary, leading to changes that lower energy consumption and reduce utility bills.
Additionally, businesses that reduce their carbon emissions can benefit from carbon credits or incentives from governments and organizations that promote sustainability. This not only helps with compliance but also leads to financial rewards.
4. Enhancing Corporate Image and Brand Loyalty
With consumers becoming more eco-conscious, businesses are facing growing pressure to demonstrate their commitment to sustainability. Having a GHG accounting system in place allows businesses to be transparent about their emissions and sustainability efforts.
Brands that actively engage in reducing their carbon footprint are often seen as more responsible and trustworthy, leading to improved customer loyalty. Eco-conscious consumers are more likely to choose products from brands that are transparent about their environmental impact.
How Does Carbon Accounting Work?
Carbon Footprint Measurement
The first step in carbon accounting is to measure a company’s carbon footprint. This involves calculating the total amount of greenhouse gas emissions produced by all business activities, including direct emissions from owned sources (Scope 1), indirect emissions from purchased electricity (Scope 2), and additional emissions in the value chain (Scope 3).
- Scope 1 Emissions: These are direct emissions from owned or controlled sources, such as fuel burned in company-owned vehicles or industrial processes.
- Scope 2 Emissions: These are indirect emissions from the generation of purchased electricity consumed by the business.
- Scope 3 Emissions: These include all other indirect emissions, such as those arising from the supply chain, employee travel, waste disposal, and product use.
GHG accounting helps businesses assess all three scopes to get a comprehensive understanding of their total emissions.
Carbon Reduction Strategies
Once the carbon footprint is measured, the next step is to identify areas for improvement. Carbon accounting provides businesses with the data they need to set actionable carbon reduction targets. These targets may include strategies like:
- Switching to renewable energy sources like solar or wind.
- Optimizing transportation logistics to reduce emissions from fuel consumption.
- Improving energy efficiency in manufacturing processes and office spaces.
- Sustainable product development and packaging to reduce the carbon footprint of products.
Implementing these strategies is essential for companies aiming to meet their sustainability goals and reduce their overall emissions.
Benefits of Carbon Accounting for Businesses
1. Competitive Advantage
Having an effective carbon accounting strategy can give businesses a competitive edge. With consumers and investors increasingly prioritizing sustainability, businesses that adopt GHG accounting are better positioned to meet the expectations of these groups. In fact, many businesses have found that their commitment to sustainability has helped them stand out in the market and attract new customers.
2. Risk Mitigation
As environmental regulations continue to evolve, businesses that practice carbon accounting are in a better position to manage regulatory and financial risks. Tracking emissions ensures that companies are not caught off guard by new carbon taxes or carbon trading schemes. This proactive approach to sustainability also helps businesses anticipate future risks related to climate change, such as disruptions to supply chains or shifts in consumer preferences.
3. Transparency and Reporting
Transparency is critical in today’s business environment. Carbon accounting provides a reliable way for companies to report their emissions to stakeholders, including investors, regulators, and consumers. By publicly sharing emissions data, companies can build trust and credibility with key audiences. The Global Reporting Initiative (GRI) and Carbon Disclosure Project (CDP) are examples of reporting frameworks that help companies disclose their emissions data in a standardized and transparent manner.
4. Long-term Sustainability Goals
Carbon accounting is not just about reducing emissions in the short term—it’s a long-term strategy that helps businesses build a more sustainable future. By measuring and reducing emissions, companies can move toward carbon neutrality, a critical goal in addressing the impacts of climate change. Through GHG accounting, businesses can set long-term sustainability goals, track progress, and ensure they are meeting their climate action commitments.
Carbon Accounting Software: Tools to Help Businesses Track Emissions
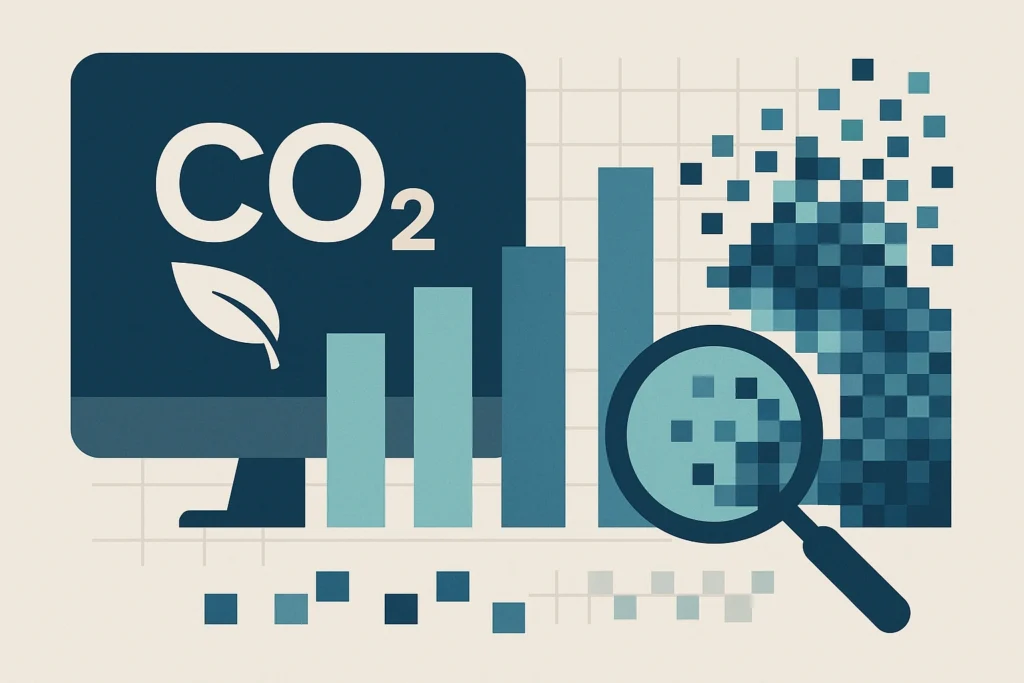
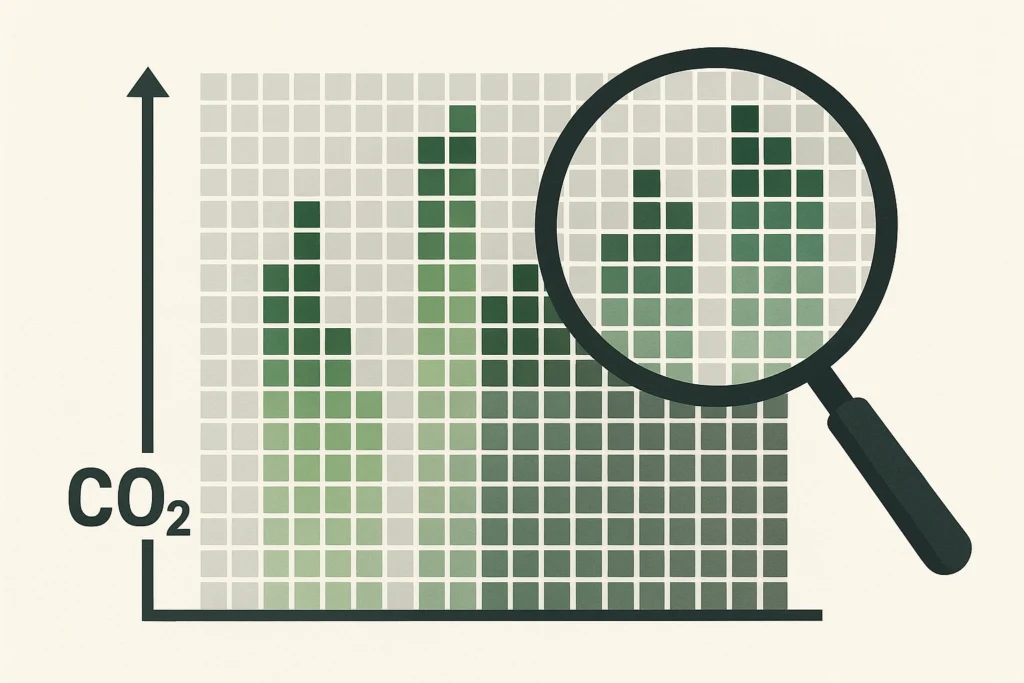
In order to streamline the GHG accounting process, many businesses use carbon accounting software. These tools automate the measurement and reporting of carbon emissions, helping companies to track their carbon footprint in real time.
Top Carbon Accounting Software in 2025
- Carbon Trust – Offers solutions for measuring, reducing, and reporting carbon emissions.
- SimaPro – Used for life cycle assessment, providing detailed insights into environmental impacts.
- Envizi – Specializes in corporate sustainability management, helping businesses reduce carbon emissions and manage energy consumption.
These tools provide valuable insights that allow businesses to set reduction targets, track progress, and ensure compliance with carbon reporting standards.
Conclusion
In conclusion, carbon accounting is an essential practice for businesses looking to reduce their carbon footprint, comply with environmental regulations, and contribute to global efforts to combat climate change. With increasing pressure from consumers, investors, and governments, businesses that embrace GHG accounting are not only fulfilling their environmental responsibilities but also gaining a competitive advantage in the market.
By adopting carbon accounting practices, businesses can improve operational efficiency, save costs, and position themselves as sustainability leaders. As the world moves toward a more eco-conscious future, GHG accounting will play a pivotal role in helping companies achieve long-term success and environmental stewardship.
Get Started with Carbon Accounting Today
Interested in reducing your company’s carbon footprint and embracing sustainability? Subscribe to our newsletter for more tips on GHG accounting and how to start measuring your emissions. Or download our guide to learn how to choose the best carbon accounting software for your business today!
This extended version provides a comprehensive overview of GHG accounting, its importance, and how businesses can integrate it into their operations. Let me know if you’d like any further adjustments!