AI-Driven ESG: How Machine Learning Shapes Corporate Climate Decisions

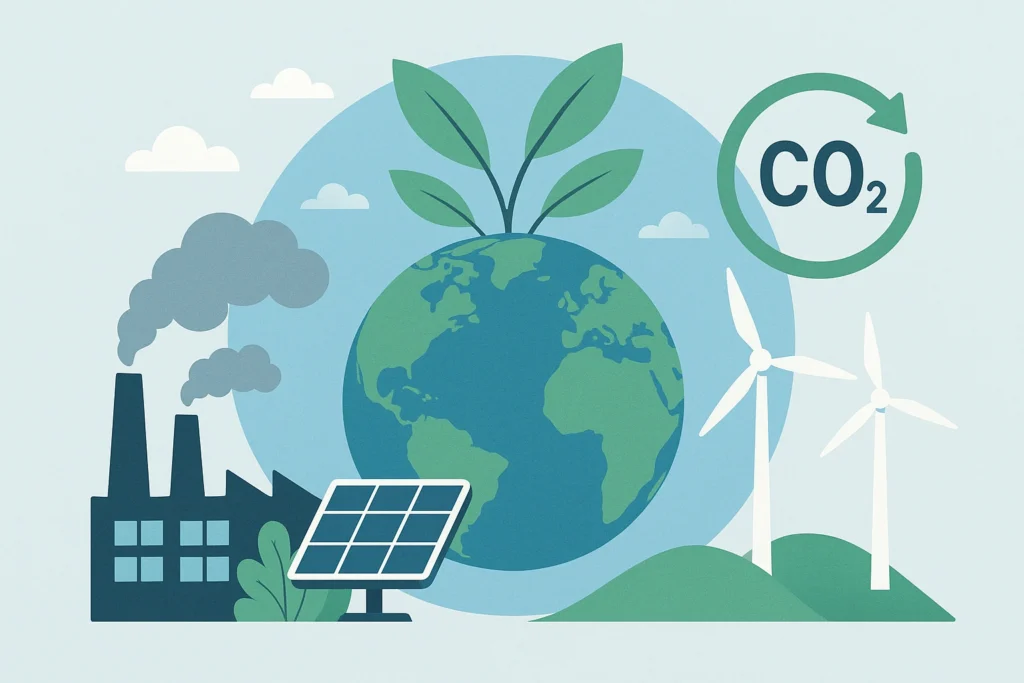
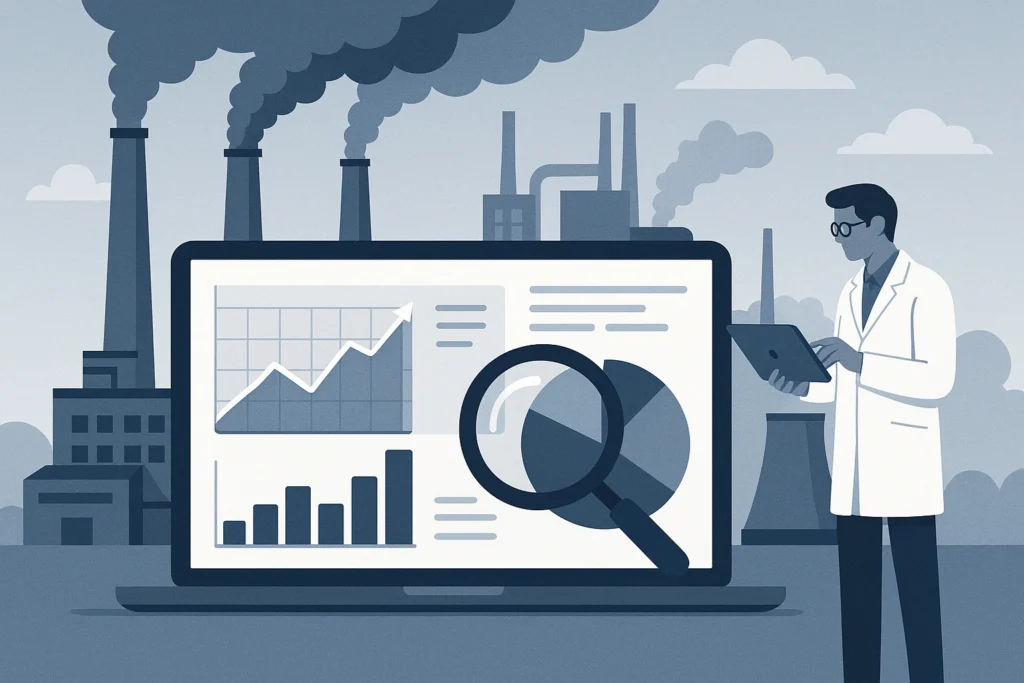
Corporate climate decisions are no longer based on annual reports or static spreadsheets. The pace of regulation, investor scrutiny, and climate risk demands faster and smarter action. This is where AI-driven ESG steps in. By applying machine learning to environmental data, companies can move from reactive reporting to proactive decision-making.
Machine learning doesn’t just analyze emissions. It detects patterns, predicts risks, and highlights opportunities for improvement. From carbon accounting software to predictive ESG analytics, AI is reshaping how organizations understand their environmental impact and plan for the future.
What AI-Driven ESG Really Means
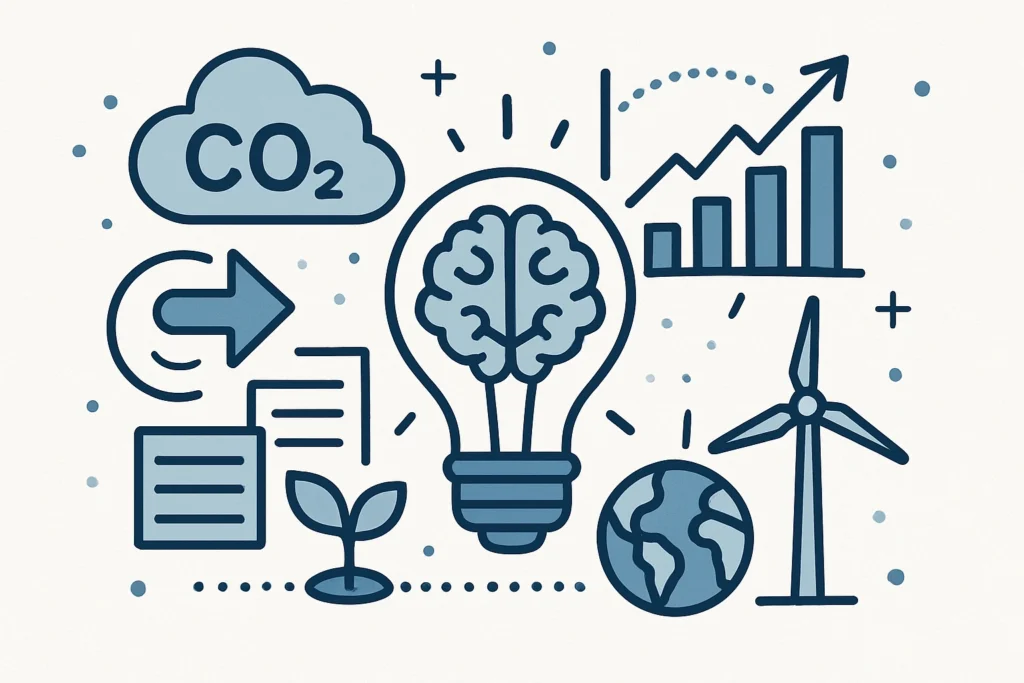
AI-driven ESG refers to the use of artificial intelligence and machine learning to measure, analyze, and guide environmental, social, and governance performance. Unlike traditional ESG tools, AI systems don’t rely solely on historical data or fixed assumptions.
Instead, they:
- Learn from changing datasets
- Adapt models over time
- Identify correlations humans often miss
This allows companies to connect emissions data, supply-chain activity, energy use, and financial performance into one decision-ready system.
Why Traditional ESG Reporting Falls Short
Many ESG programs still depend on manual data collection. This creates delays and blind spots. Common challenges include:
- Incomplete Scope 3 data
- Inconsistent reporting standards
- Lag between data collection and action
- Limited ability to forecast future risk
Static ESG reports explain what happened last year. They don’t explain what happens next. Machine learning climate decisions close that gap.
How Machine Learning Changes Climate Decision-Making
Pattern Recognition at Scale
Machine learning excels at identifying patterns across massive datasets. For ESG teams, this means understanding how small operational changes affect emissions over time. AI can link energy spikes to production cycles or supplier behavior without manual analysis.
Real-Time Insights
Instead of waiting for quarterly reviews, AI systems analyze data continuously. This supports faster responses to climate risks, regulatory changes, or supply disruptions.
Scenario Modeling
Machine learning enables companies to test climate scenarios. What happens if energy prices rise? What if a supplier fails emissions standards? Predictive models simulate outcomes before decisions are made.
AI in Carbon Accounting Software

Modern AI in carbon accounting software goes beyond emissions calculation. These systems automatically ingest data from:
- Energy meters
- ERP systems
- Logistics platforms
- Supplier disclosures
Machine learning improves data quality by flagging anomalies, filling gaps, and refining emission factors over time. The result is more accurate, auditable, and defensible carbon data. This matters for compliance, but also for strategic planning.
Also See: How Carbon Footprint Accounting Helps Businesses Go Green
Predictive ESG Analytics: From Reporting to Forecasting
Predictive ESG analytics uses machine learning to estimate future environmental performance. This shifts ESG from compliance to strategy. With predictive models, climate decisions become data-driven instead of assumption-driven. Key capabilities include:
- Forecasting emissions growth under current operations
- Identifying high-risk suppliers before issues escalate
- Predicting carbon cost exposure under future regulations
- Evaluating ROI of sustainability investments
Data-Driven Sustainability in Practice
Data-driven sustainability means decisions are backed by evidence, not intuition. AI enables this by connecting ESG data with operational and financial metrics. For example:
- Emissions data linked to production output
- Energy efficiency tied to cost savings
- Supplier performance connected to risk scoring
This integration helps sustainability teams speak the same language as finance and operations.
Corporate ESG Analytics and Executive Decision-Making
Executives need clarity, not dashboards full of noise. Corporate ESG analytics powered by AI distill complex data into actionable insights. AI helps leadership:
- Prioritize decarbonization projects
- Allocate capital efficiently
- Balance climate goals with business growth
- Track progress against net-zero commitments
When ESG data is intelligent, climate strategy becomes part of core business planning.
Intelligent Sustainability Systems

An intelligent sustainability system is not a single tool. It’s an ecosystem where AI connects data, analytics, and action. These systems:
- Learn from historical performance
- Adjust targets dynamically
- Recommend actions based on impact and cost
- Support continuous improvement
They replace static ESG roadmaps with adaptive climate strategies.
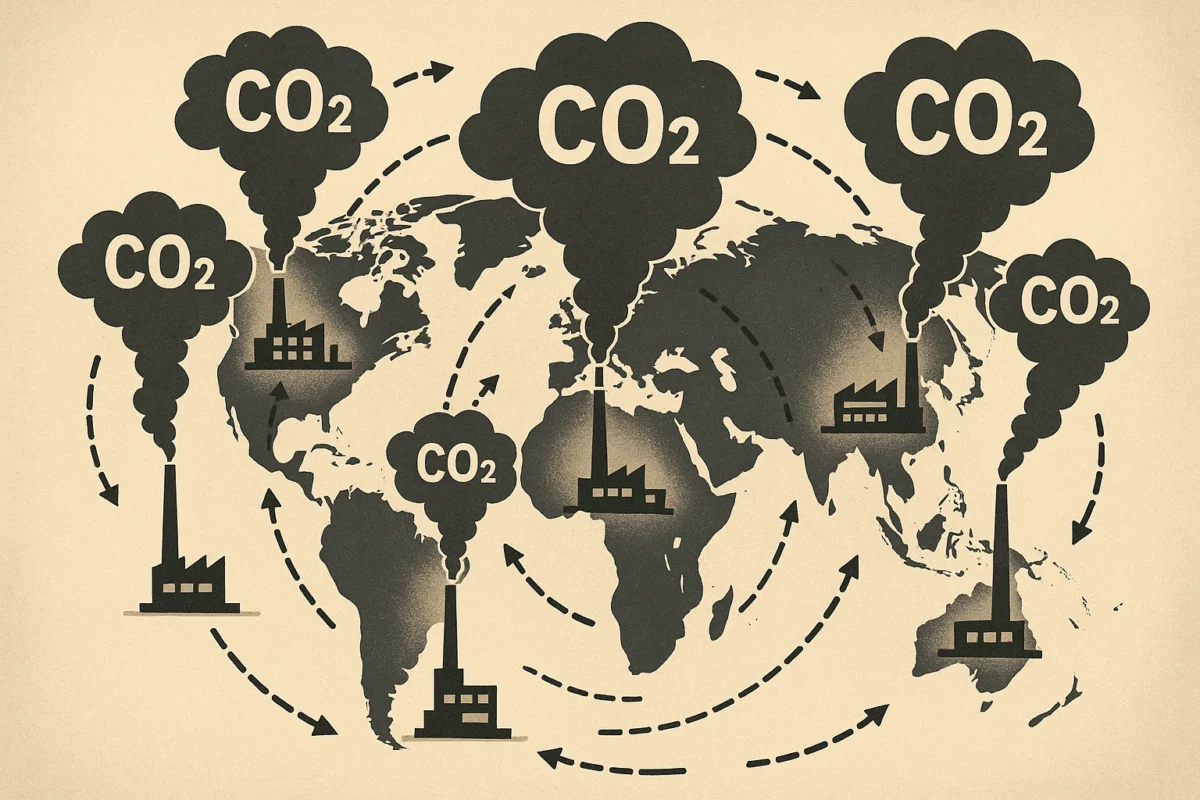
AI-Driven ESG and Regulatory Readiness
Climate regulations are evolving fast. AI helps companies stay ahead by tracking regulatory signals and modeling compliance outcomes. This includes:
- CSRD and SEC climate disclosure readiness
- Carbon tax exposure forecasting
- Audit-ready emissions documentation
Machine learning reduces regulatory risk by improving accuracy and transparency.
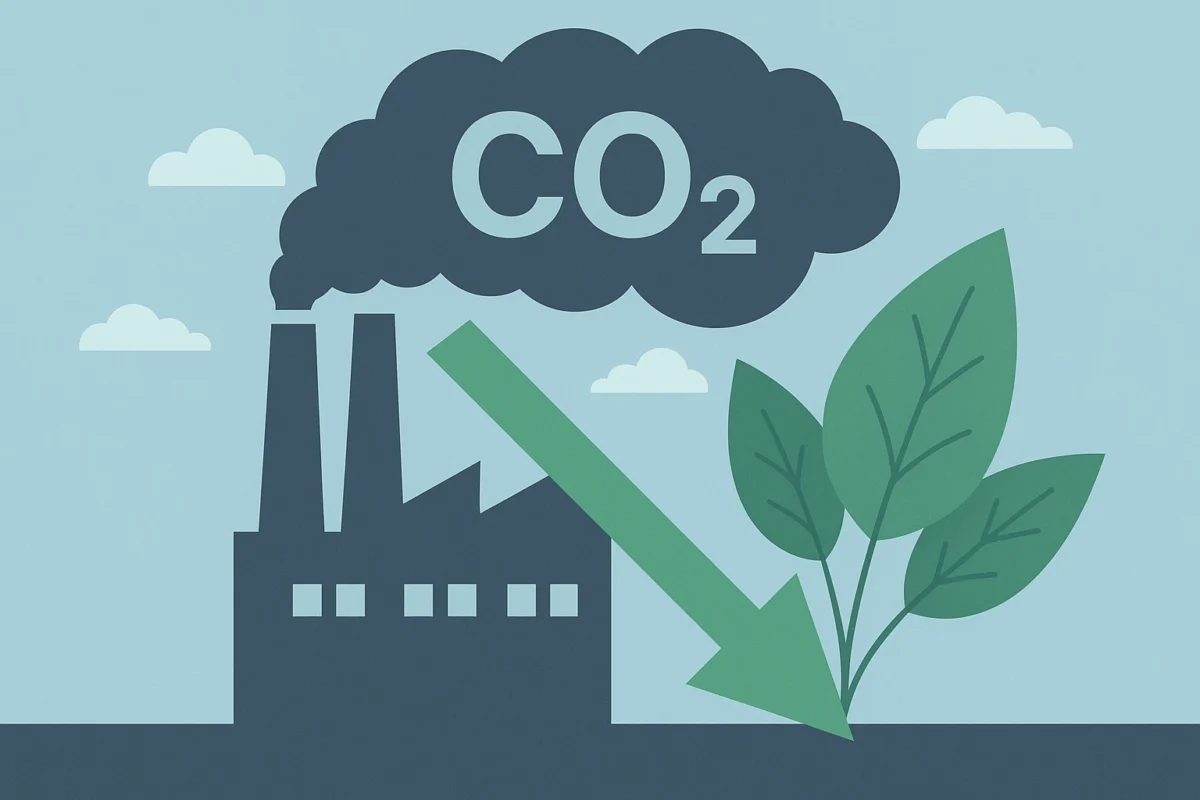
Conclusion
AI-driven ESG is changing how companies think about climate action. By combining machine learning climate decisions, predictive ESG analytics, and intelligent sustainability systems, organizations gain clarity, speed, and confidence.
The shift is clear. ESG is no longer about reporting what happened. It’s about shaping what happens next.
FAQ: AI-driven ESG
What is AI-driven ESG?
It is the use of machine learning and AI to analyze ESG data, predict risks, and guide sustainability decisions.
How does machine learning improve climate decisions?
It identifies patterns, forecasts outcomes, and supports scenario planning using real-time data.
Is AI useful for Scope 3 emissions?
Yes. AI helps estimate, validate, and continuously improve Scope 3 data across complex supply chains.
Can small companies use AI-driven ESG tools?
Yes. Cloud-based platforms make predictive ESG analytics accessible beyond large enterprises.